

Brief exposure of neuronal cells to levels of SCFAs observed in human systemic circulation impair
- FunctionalFoodsLab

- Sep 15, 2022
- 5 min read
Tiffany A. Fillier, Shrushti Shah, Karen M. Doody, Thu H. Pham, Isabelle Aubry, Michel L. Tremblay, Sukhinder K. Cheema, Jacqueline Blundell & Raymond H. Thomas
Published 23 August 2022
https://doi:10.1038/s41598-022-18363-w
Abstract
Communication between gut microbiota and the brain is an enigma. Alterations in the gut microbial community affects enteric metabolite levels, such as short chain fatty acids (SCFAs). SCFAs have been proposed as a possible mechanism through which the gut microbiome modulate brain health and function. This study analyzed for the first time the effects of SCFAs at levels reported in human systemic circulation on SH-SY5Y human neuronal cell energy metabolism, viability, survival, and the brain lipidome. Cell and rat brain lipidomics was done using high resolution mass spectrometry (HRMS). Neuronal cells viability, survival and energy metabolism were analyzed via flow cytometer, immunofluorescence, and SeahorseXF platform. Lipidomics analysis demonstrated that SCFAs significantly remodeled the brain lipidome in vivo and in vitro. The most notable remodulation was observed in the metabolism of phosphatidylethanolamine plasmalogens, and mitochondrial lipids carnitine and cardiolipin. Increased mitochondrial mass, fragmentation, and hyperfusion occurred concomitant with the altered mitochondrial lipid metabolism resulting in decreased neuronal cell respiration, adenosine triphosphate (ATP) production, and increased cell death. This suggests SCFAs at levels observed in human systemic circulation can adversely alter the brain lipidome and neuronal cell function potentially negatively impacting brain health outcomes.

Figure 1 Lipid analysis completed on SH-SY5Y neuronal cells show global alterations due to SCFA treatment. (A) Quality of differentiation and neuronal health in control and treated neurons. (B) C30RPLC/HILIC extraction ion chromatography example (XIC) in −/+ mode respectively of Phosphatidylethanolamine (PE) (m/z750) and Acyl Carnitine (AC) lipids found in neuronal cells (C) C30RP spectrum identification of PE18:0/20:4, isomers PE16:0p/22:4, PE18:0p/20:4 and HILIC spectrum identification D-labeled carnitine species C0 (free carnitine), AC-C4, and AC-C16. (D) Percent change by lipid class of treated neuronal cells vs control for Ceramides (Cer), Glycosylceramide (CerG1), Lyso-Phosphatidylcholine (LPC), Phosphatidylcholine (PC), Phosphatidylethanolamine (PE), Lyso-Phosphatidylethanolamine (LPE), Cardiolipin (CL), Free Carnitine (C0), Total Acyl Carnitine (AC), and OH/short/medium/long/even/odd chained AC. N = 4 samples per treatment group (50 μM, 100 μM, 1000 μM) replicate. (E) Alterations in overall acids, including SCFAs, in complementary rat brain study. Bar charts representative of means ± standard error. Means represented by different superscripts are significantly different at p < 0.05. N = 6 per treatment group, M male, F female, C control, T treated.

Figure 2 Alteration in free carnitine (C0) and acyl-carnitine (AC) composition after SCFA treatment. (A) PCA biplot showing relationship between SCFA treatment and carnitine molecular species. ANOVA revealed significantly (p < 0.05) altered carnitine molecular species in quadrant 1 (B), quadrant 2 (C), quadrant 3 (D) of the PCA. (E) Percent change of treatments vs respective controls for ANOVA significant (p < 0.05) acyl-carnitine species altered in both neuronal cells and Long Evans rat brain. Species determined via PCA and Differential Expression, respectively, prior to ANOVA. Bar charts representative of means ± standard error. Means represented by different superscripts are significantly different at p < 0.05.
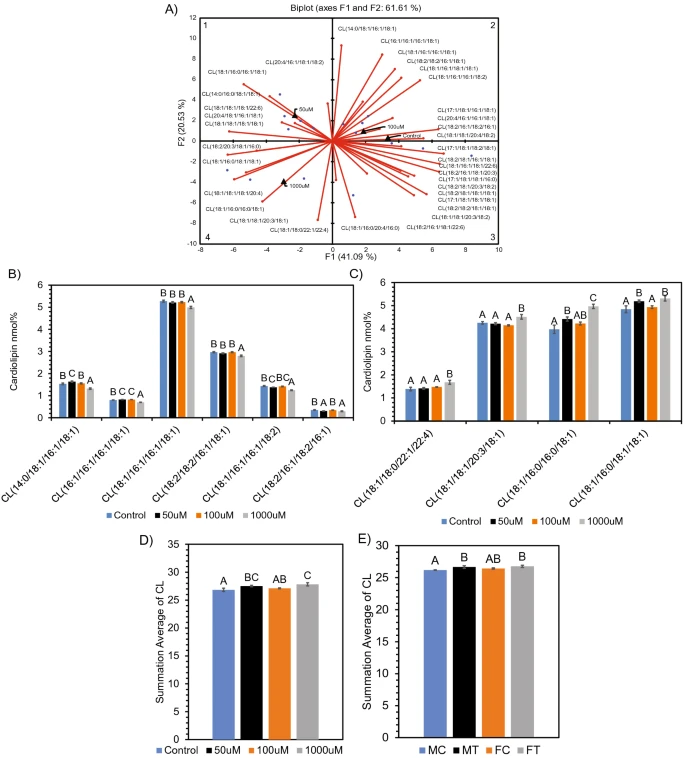
Figure 3 Alteration in cardiolipin (CL) composition after SCFA treatment. (A) PCA biplot showing relationship between SCFA treatment and cardiolipin molecular species. ANOVA revealed significantly (p < 0.05) altered CL molecular species in quadrant 2 (B), quadrant 4 (C) of the PCA. Average sum of all ANOVA significant (p < 0.05) CL species altered in (D) neuronal cells and (E) Long Evans rat brain. Species determined by PCA and Differential Expression, respectively, prior to ANOVA. Bar charts representative of means ± standard error. Means represented by different superscripts are significantly different at p < 0.05.
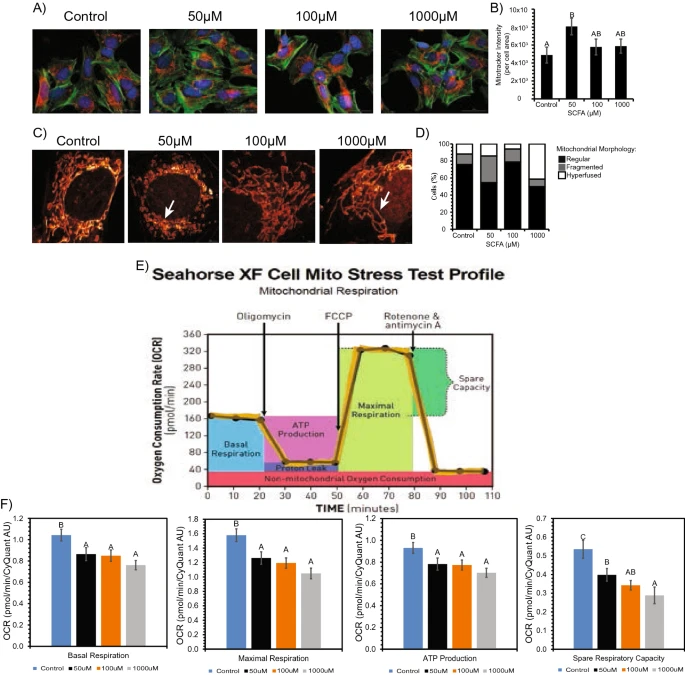
Figure 4 Morphological changes observed in the mitochondria between control vs SCFA treated neuronal cells. (A) Mitotracker Deep Red under Cytation3 Imaging revealed increased dye intensity after treatment. (B) Bar graph numerically represents increase in dye intensity. Bars represent mean ± standard error. Different superscripts represent statistically significant increase (p < 0.05). (C) STED imaging revealed fragmented (50 μM) and hyperfused (1000 μM) mitochondria after treatment. (D) 100% stacked column graph numerically represents relationship of regular, fragmented and hyperfused mitochondria per treatment. (E,F) Decrease in respiratory capacity and ATP production in neuronal cells after treatment. (E) Representative of general mitochondrial stress test profile and outputs from Seahorse XF as it measures OCR over time (from Agilent). (F) Seahorse XF analysis results after SCFA treatment showing an overall decrease in basal respiration, maximal respiration, ATP production, and spare respiratory capacity. Bars represent means ± standard error. Different superscripts represent statistically different (p < 0.05) decreases in respiration and ATP.
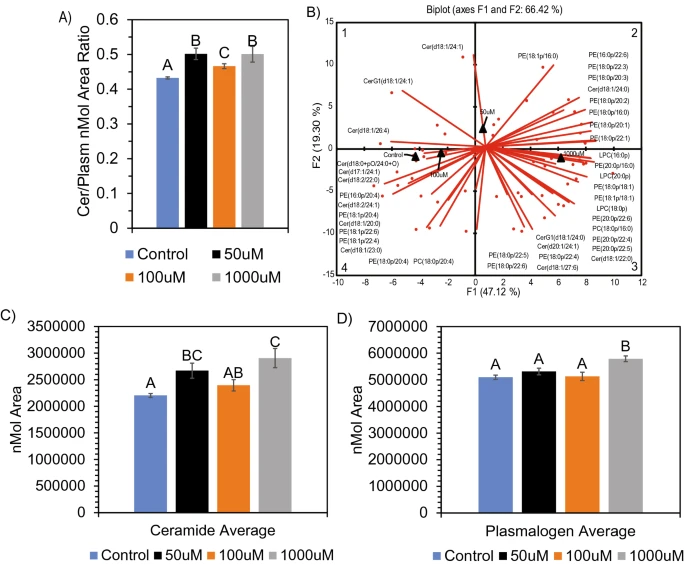
Figure 5 Alteration in ceramide and plasmalogen composition in neuronal cells after SCFA treatment. (A) Increased ratio of ceramide: plasmalogens after treatment. (B) PCA biplot showing alteration in both ceramide and plasmalogen molecular species between control/100 μM, 50 μM, and 1000 μM SCFA treatment. ANOVA of average nmol area for both ceramide (C) and plasmalogen (D) showed significant (p < 0.05) difference after SCFA treatment. Ceramides show an average fold-change increase of 1.32 and plasmalogens show an average fold-change increase of 1.14 after 1000 μM treatment. Bar charts representative of means ± standard error. Means represented by different superscripts are significantly different at p < 0.05.
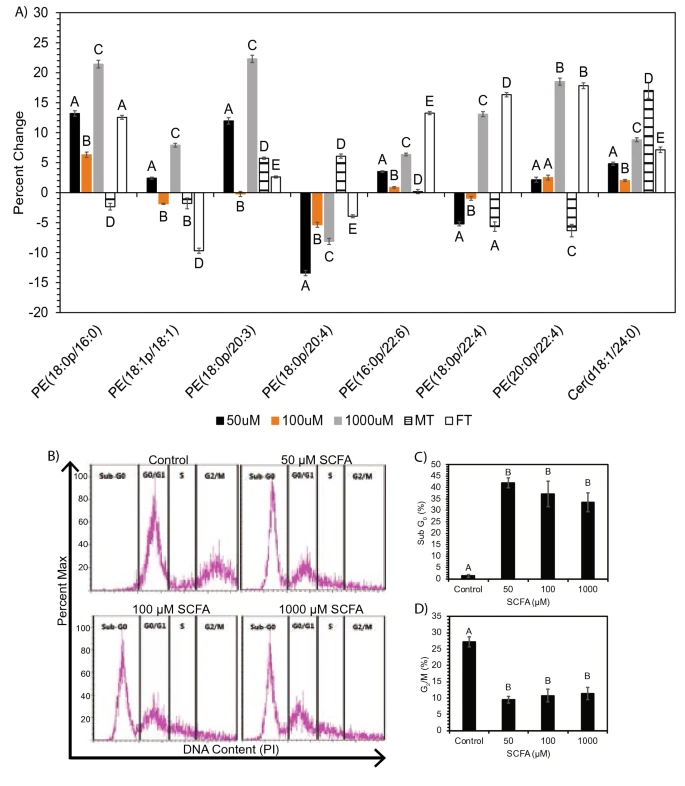
Figure 6 (A) Percent change of treatments vs respective controls for ANOVA significant (p < 0.05) plasmalogen and ceramide species altered in both neuronal cells and Long Evans rat brain. Significance was determined via ANOVA following PCA analysis for plasmalogen and ceramide in-vitro and in-vivo. Bar charts representative of mean ± standard error. Means represented by different superscripts are significantly different at p < 0.05. MT male rats treated with SCFAs, FT female rats treated with SCFAs. (B–D) SCFA treatment of neuronal cells causes increased apoptosis accompanied by loss of cells in G2/M. (B) Representative flow cytometry plots of propidium iodide (PI) staining of neuronal cells treated with control or 50–1000 μM SCFA. (C) Frequency of cells in sub-G0 (apoptotic) and (D) G2/M phases of the cell cycle. Bar charts representative of mean ± standard error. Means represented by different superscripts are significantly different at p < 0.05.
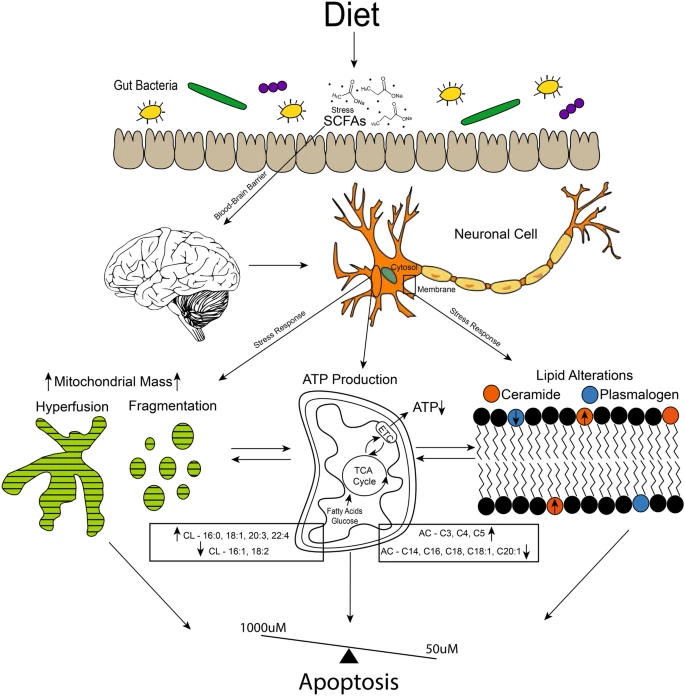
Figure 7 Proposed mechanism for neuronal cell response to levels (50–1000 μM) of SCFAs observed in systemic circulation. SCFAs are received via infermentable carbohydrates in the diet, which are fermented by the gut microbiota population. SCFAs are able to cross the blood–brain barrier (BBB), which at elevated levels caused stress responses in brain neuronal cells. This stress response is shown in our study via alterations in lipids that make up the cell membrane bilayer, such as the increase observed in ceramide vs plasmalogen species. Mitochondrial lipid membrane is also altered, as observed by cardiolipin (CL) and acylcarnitine (AC) profiles. Mitochondria also display increased mass, hyperfusion (1000 μM), fragmentation (50 μM), and decreased ATP production. All of which are linked to apoptotic cell response, which we observed during cell cycle analysis. Although the 100 μM treatment is not completely normal, it does not show major alterations compared to the 50 μM and 1000 μM treatments. This suggests a possible dose balance response between the treatments.


Comments